The piping and instrumentation diagram as the basis for sustainable process design

How detailed piping and instrumentation diagrams support engineers by clearly visualising plant components and piping in process engineering.
In process engineering, plant design is considered one of the biggest challenges of the entire conceptualisation process. Design is facilitated by the use of piping and instrumentation flow diagrams, or P&ID flow diagrams for short.
What is a piping and instrumentation diagram?
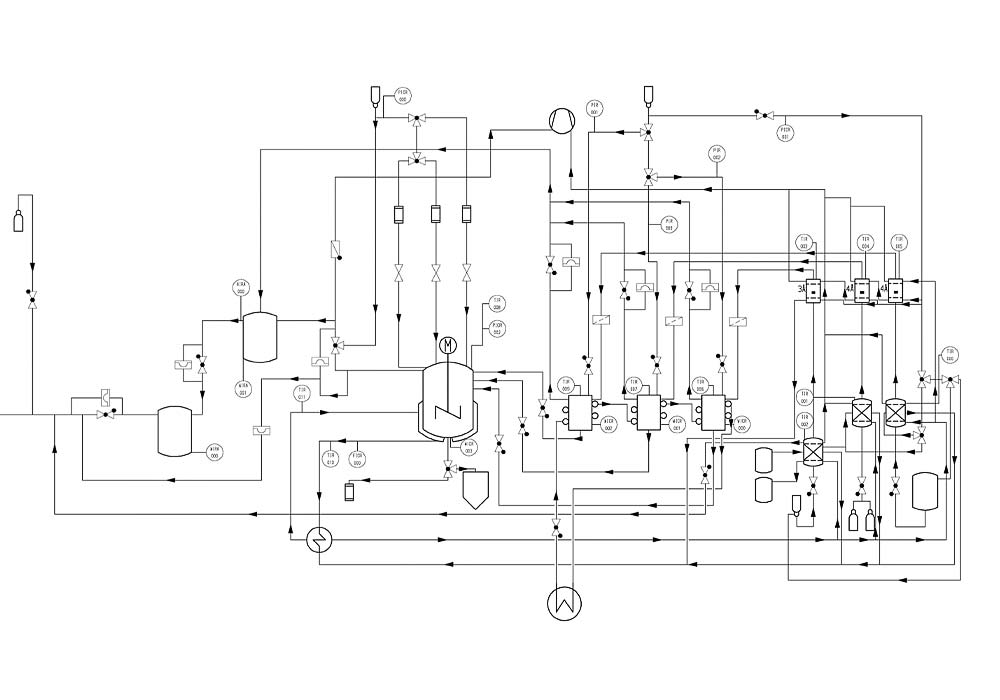
A piping and instrumentation diagram is a detailed diagram that uses graphic symbols to illustrate the system components, pipework and their functions in measurement and control technology. P&ID flow diagrams are indispensable in many industrial sectors. However, flow diagrams also help to maintain an overview during operation and to identify and eliminate faults at an early stage. Nowadays, modern P&ID design tools make it much easier to create flow diagrams.
What are piping and instrumentation diagrams used for in modern process engineering?
There are numerous industries where piping and instrumentation diagrams form the basis for all production systems. They serve as an interface in the design and control of machines and units whose functions should be coordinated both smoothly and efficiently. Due to the large number of industries and their specific requirements, different design and documentation tools are used for the respective areas. In the area of pipes and instrumentation, powerful CAD software is almost always used today, whereas in the past, manual production with symbol templates and technical drawing tools was common. Electronic data processing allows the information from the various systems to be better summarised and coordinated with the overall system.
Importance of piping and instrumentation diagrams for various industries
Piping and instrumentation diagrams are indispensable in almost all industries in which process engineering is used. Essentially, they are used wherever pipework and instruments are required on machines, units and conveying circuits. The range of applications for P&ID diagrams is correspondingly broad.
Important industries that use P&ID in process engineering:
- Food industry
- Pharmaceutical industry
- Chemical industry
- Metal industry
- Waste and disposal management
- Textile processing industry
- Paper industry
- Environmental technology
- Utilities (e.g. water supply, heat supply, etc.)

Easy to use P&ID software for creating and editing intelligent piping and instrumentation diagrams (P&IDs). Benefit from the many advantages, functionality and great service.
Basics for using piping and instrumentation diagrams
What is a piping and instrumentation diagram?
All process flow diagrams – including P&ID flow diagrams – are diagrams in which material flows, machines and units, connections and, where applicable, the control and regulation of technical systems are visualised. The clear representation of complex processes facilitates the design, modelling and optimisation of processes in process engineering. They are used in the design phase and later when analysing running processes. They also serve as a basis for drawing up specifications, instructions and operating parameters for a plant. Ultimately, a P&ID flow diagram contains all the process information and details about the various components.
Objective of piping and instrumentation diagrams
Such a diagram provides participants with an overview of the processes and flows. Piping and instrumentation diagrams are constructed step-by-step and range from individual component groups to complex systems, processes and tasks. The piping and instrumentation diagram is the most important document for the basic engineering of systems and defines the tasks for the respective specialist departments.
History of the piping and instrumentation diagram
The idea of visualising processes using flowcharts was developed at the end of the 19th century by American engineer Frank Bunker Gilbreth. Unlike many of his contemporaries, Gilbreth placed more emphasis on optimising working methods than on increasing work performance. Ergonomic working and logical instructions for workers were important elements of his research work. He also used flow diagrams to establish the later development of process mapping for piping and instrumentation diagrams.
Elements of a typical piping and instrumentation diagram
P&ID flow diagrams are prepared according to the rules of DIN EN ISO 10628, particularly in the chemical and petrochemical industry. They should not only contain basic information but also provide essential additional information, whereby the latter is optional. Compared to other process diagrams, the piping and instrumentation diagram provides, by far, the greatest density of information. It is based on the general concept of the process flow diagram and supplements this with electrical measurement and control technology (EMSR). Additional symbols for pipework are contained in DIN 2429. Effective lines for control and regulation elements must be shown in accordance with DIN 19227. The labelling systems used can differ depending on the industry; components are particularly frequently labelled according to the KKS (power plant labelling system), which is also used in chemical plants, among others. Details on the labelling system can be found in DIN 6779.
Minimum requirements for a piping and instrumentation diagram
The minimum requirements for the basic information on a piping and instrumentation diagram include the following definitions:
- Function and type of machinery and equipment used. Included are drive elements, conveyor systems and reserve installations
- Labelling of the above machines and appliances
- Labelling the sizes of equipment and machines used
- Listing of basic data such as nominal diameter, pressure rating, material and design of the required pipework
- Details of machines, apparatus, pipework, fittings and valves (can be listed separately)
- Symbols and letter codes for variables, control and regulation functions; description of the process control task including corresponding symbols
- Characteristics and operating data of drive elements (listing in separate lists possible)
Information contained in a piping and instrumentation diagram
In addition, the following information can be included in a P&ID flow diagram:
- Information on energy quantities and energy sources
- Flow path and flow direction of energy carriers or energy
- Information on important control, regulation and measuring devices
- Materials of machines and appliances
- Mounting height of the platform and indication of the relative vertical position of system components
- Valve labelling
- Detailed designation of various system components
Descriptions of abbreviations for measuring and control points according to DIN 19227
If a piping and instrumentation diagram contains measuring and control points, they can be labelled using one of the following abbreviations. These abbreviations, depending on the sequence of letters, indicate the function and purpose of a measurement. Supplementary and sequential letters may also be used. It should be noted that these designations should not contain all details but only serve as a reference for the instrument data sheet. The identification number can be used to look up information such as measuring range, limit values, installation instructions and similar information.
First letter of the abbreviations
Density: D
electrical sizes: E
Flow rate: F
Manual input or manual intervention: H
Fill level: L
Humidity: M
Print: P
Fabric quality: Q
Speed or rotational speed: S
Temperature: T
Viscosity: V
Mass: W
The following additional or subsequent letters are also possible:
Difference: D
Ratio: F
Total (total flow rate, etc.): Q
Alarm: A
Regulated: C
Display: I
Recording: R
Gearstick: S
Note intervention: Y
Upper or lower limit: + or –
Classification of different types of flow diagrams
The application purposes of P&ID flow diagrams are similar in most industries. They usually involve one or more of these tasks:
- Illustration of a pipeline within a process plant
- Presentation of an overview of a process engineering system (including instrumentation)
- Presentation of function overviews for machines and appliances
The actual type of flow diagram depends on the target group for which the document is created. For example, piping and instrumentation diagrams differ in their information density and complexity depending on whether they contain a simplified representation for investors with business aspects or are created for the plant operator, who requires a complete and detailed flow diagram.
Easy to use P&ID software for creating and editing intelligent piping and instrumentation diagrams (P&IDs). Benefit from the many advantages, functionality and great service.
Piping and instrumentation diagrams for various industries
Chemical industry
P&ID diagrams are indispensable in the chemical and/or petrochemical industry. Hardly anywhere else are there so many complex pipelines and instrumentation in such a small space that are required for different processes. In chemical process engineering, this involves the conversion of substances by means of chemical reactions. During design, particular consideration must be given to the possibility of undesirable reactions to be expected when handling the various substances. Additional equipment with pipework for heat supply or cooling are also important components of P&ID flow diagrams.
Oil and gas industry
Naturally, the primary and by-products of oil and gas processing in refineries and other petrochemical plants are primarily realised via pipelines. By condensing and separating crude oil into different fractions, different hydrocarbon derivatives essential for other purposes can be obtained. This applies not only to fuel production in the form of petrol, diesel or propane gas but also to auxiliary and starting materials for the production of plastics, medicines and similar products.
Food industry
The efficient production and processing of food on an industrial scale is not possible without sophisticated process engineering. Material and substance transport with conveyor systems and pipework, processing and packaging machines and cooling or heating systems are dependent on careful design with a piping and instrumentation diagram. From the delivery of raw materials to the processes within further processing and preparation for onward transport, many complex processes must be coordinated and perfected to ensure smooth operation. The strict hygiene requirements must be considered, which always presents a particular challenge for plant designers.
Pharmaceutical industry
Like the food industry, the pharmaceutical industry relies on hygienically perfect production environments. However, the processes are often similar to those in the chemical and petrochemical industries, placing corresponding demands on the design of process engineering systems.
Power generation
It is no coincidence that the KKS power plant labelling system plays a major role in creating piping and instrumentation diagrams in process engineering. Regardless of which fuels or processes are used to generate energy, pipework, measurement and control technology and conveyor systems are almost always used to transport materials. To avoid unplanned downtimes and expensive shutdowns in power plants, a perfect piping and instrumentation diagram is particularly helpful in visualising all the processes and procedures.
Different types of flow diagrams
In addition to piping and instrument flow diagrams, there are other types of flow diagrams in process engineering that differ depending on the task.
Process flow chart
This is a detailed description of the functions and sequences of technical processes, such as those in production areas. It is characterised by the use of graphic symbols for machines, equipment and material and energy flows. The most important parameters for the operation of the system are usually also included in the flow diagrams.
P&ID flow diagram (piping and instrumentation diagram)
The P&ID diagram is used to create particularly detailed design documents. It lists all pipe routes, connections, fittings and instruments. Connection types, materials, media, nominal sizes and similar component parameters are also included. When creating piping and instrumentation diagrams, it is recommended to ensure the correct use of standardised symbols as required by the relevant standards.
Basic flow chart
The basic or block flow diagram is a simplified graphical representation of process steps, operations, or complete systems. It is usually dominated by rectangles connected with corresponding arrows and lines to visualise the respective material and energy flows or sequences of the processes. Information on temperatures, pressure ratios or material concentrations can also be shown.
Easy to use P&ID software for creating and editing intelligent piping and instrumentation diagrams (P&IDs). Benefit from the many advantages, functionality and great service.
Piping and instrumentation diagram in detail
Various tasks need to be covered when designing a process plant, with process design being one of the most critical. This involves creating a suitable process flow diagram. The piping and instrumentation diagram is of particular importance in the design process. Ultimately, the result is a diagram that contains all relevant process information and details of the components used.
The importance of intelligent design in plant engineering
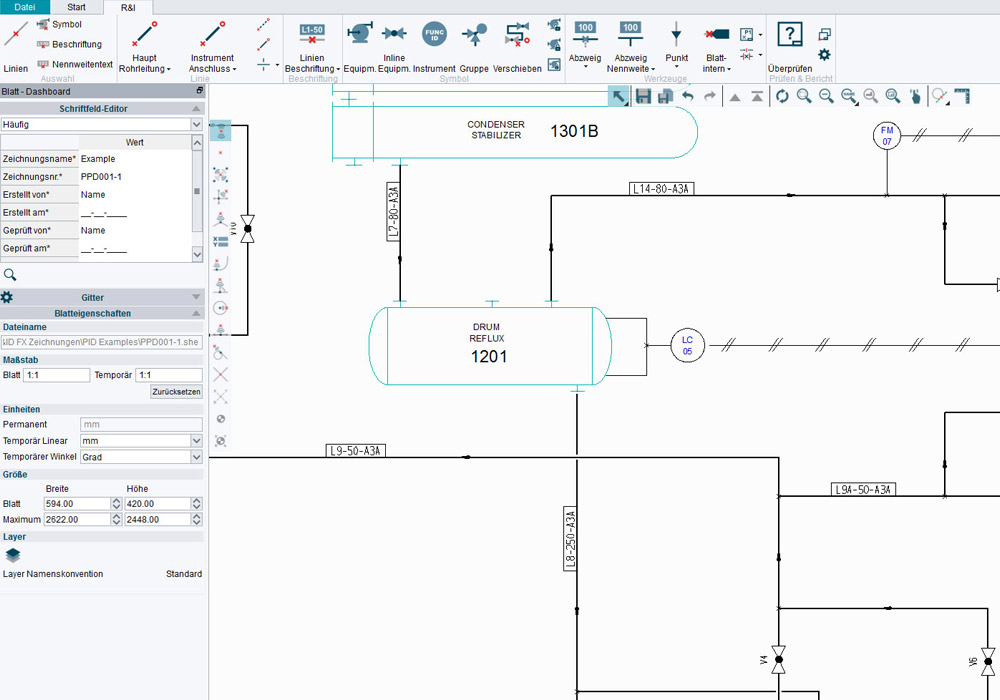
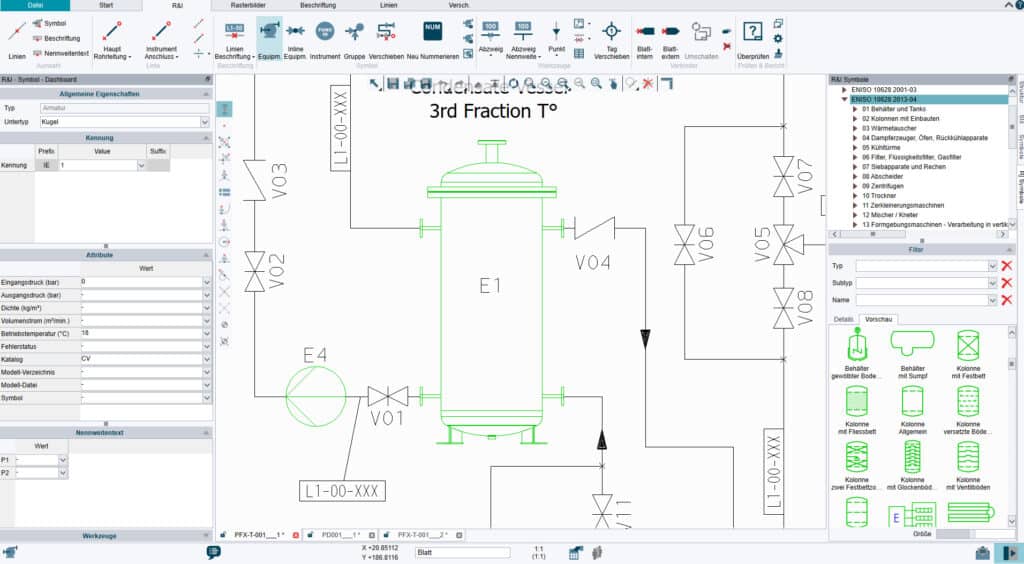
In the past, P&ID flow diagrams were more or less simple graphics. Modern software tools help create flow diagrams and ensure that the diagrams ultimately become an intelligent design tool. This is made possible by so-called attributes containing important details and data. The latter becomes very important in the further design and production of the process plant. Attributes not only contain a large amount of data but also represent an intelligent design tool that enables the information to be analysed and evaluated. This level of detail is not possible with classic flow diagrams. Good CAD solutions utilise attributes as a powerful P&ID design tool.
Advantages of using intelligent software
For designers, there are several advantages to using intelligent process engineering software. Whereas previously, the properties of all components had to be recorded individually by hand in various documents, the design software creates analysable documentation already integrated into the piping and instrumentation diagrams. This means that when creating the flow diagrams, the design team only has to enter the properties of components during the placement of symbols and lines. This information can be used anytime for reports, parts lists, analyses and other evaluations. Further documentation no longer needs to be created manually, significantly reducing susceptibility to errors. In addition, the software always uses the latest version of the design so that corrections to one component do not have to be manually transferred to all other documents.
Procedure for creating a flow diagram
Without schematic drawings, it would be impossible to create complex technical systems. Among other things, a flow diagram ensures that the functions of the system can be designed and tried out in detail in advance. After all, all the functions are based on compelling logic, meaning design errors are usually detected quickly. Technical parameters of systems can then be monitored and analysed in detail. It makes sense to create a piping and instrumentation diagram for the design of the following systems, for example:
- Electrical systems and circuits
- Gas, oil and energy supply systems
- Technical processes in the industry
- Technical processes in other areas
- Ventilation and air extraction systems
- Turbine control systems (e.g. gas turbines)
- Heating systems of any size
- Drinking water and wastewater supply
Creating a flow diagram in 3 steps
Step 1: Define requirements and select a suitable flow chart type
Every flow diagram begins with the definition of the desired level of detail. Piping and instrumentation diagrams are generally more detailed than block flow diagrams. Depending on the type of design required for the process plant, there are various process flow diagrams to choose from. Firstly, the properties of the most important components of the system must be researched. They are then arranged in a logical sequence, which will be used later. In the next step, material and energy flows are represented by lines and arrows connected to the components.
Step 2: Document key data
Once the most important requirements and components have been determined, all relevant characteristics of machines, appliances or other consumers should be defined and documented. This may include information on material consumption, power consumption, temperatures, vapour quantities and similar parameters. Once this information is available, a much more detailed process flow diagram is created from the initial drafts of the block diagram.
Step 3: Create a piping and instrumentation diagram
The process flow diagram that is now available serves as a template for the creation of a P&ID flow diagram, in which all required media-carrying pipes, instruments and fittings are entered. After the graphical creation of the flow diagrams, the design continues with the definition of materials, nominal diameters and connections. All requirements and specifications are recorded in this phase. The necessary measuring, control and regulating lines are also taken into account. The result is an extremely detailed flow diagram used for coordination with other departments and as a template for the subsequent assembly of the process plant.
Easy to use P&ID software for creating and editing intelligent piping and instrumentation diagrams (P&IDs). Benefit from the many advantages, functionality and great service.
Identification and placement of relevant elements
The step-by-step approach means that many sources of error in the design can be avoided from the outset. The correct identification and placement of the required elements is crucial. Collaboration with other experts and specialist departments is a good way to achieve this, as they help monitor the design’s progress. While the initial design phase is about the logical linking of the functions of system components, in later phases, all pipes, apparatus and instruments or fittings must be correctly designed. The importance of the hydraulic-physical conditions in the pipework system is often underestimated. They must be checked repeatedly to ensure the system functions smoothly and without errors. This is also important in the event of subsequent revisions, repairs or complex conversions to the system.
Best practices for the design and creation of flow diagrams
Right from the initial design stages, it is essential to ensure that only the correct and appropriately standardised symbols are used for the respective application area. Particularly in the case of piping and instrumentation diagrams, this procedure helps to ensure that no misunderstandings can arise regarding the parts and components used, both during the design phase and later during operation. In this context, it has proven to be very useful to create a legend in which not only the symbols used and their meaning are recorded. It also serves as a reference for the assignment of media to their respective line types and line colours in the diagram. The more unambiguous the graphic, the better. All relevant information should be clearly identifiable to prevent confusion and other errors later.
Use suitable software tools for creating flow diagrams
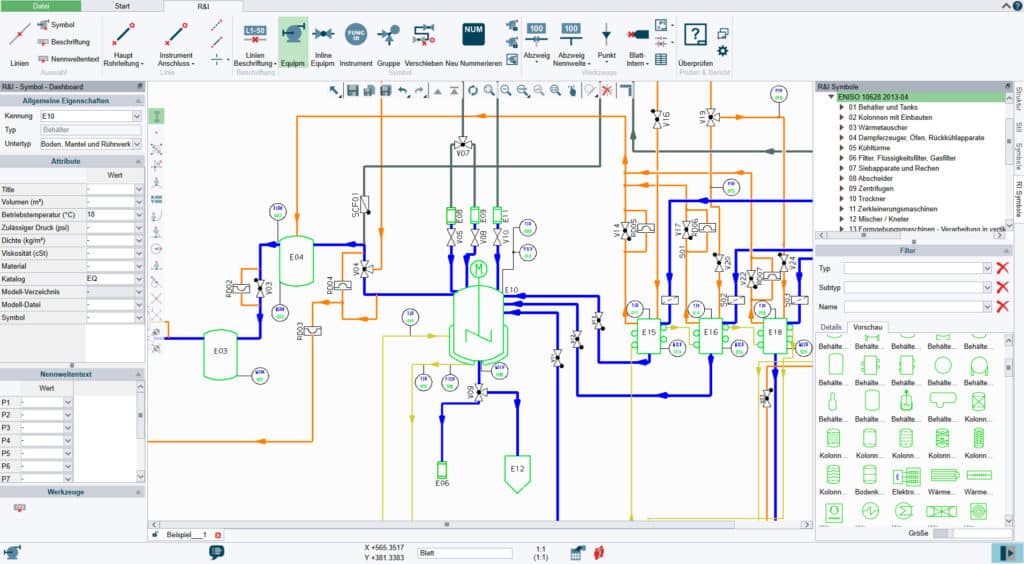
Nowadays, it is best to use suitable and powerful P&ID software for this work, which is also capable of creating intelligent flow diagrams. This simplifies the entire design process and makes it easier to enter the appropriate symbols. Many design programs already contain a corresponding symbol library corresponding to the standards and areas of use. If required, they can also be expanded or adapted to other requirements. In addition, most software solutions can check the design for consistency. In other words, they check all elements of the P&ID flow diagram for conflicts, illogical sequences or other errors. Creating automatic error lists makes it much easier to find and rectify problems. Provided the experts insert the required parameters into the design data, flow diagrams can also take over parts of the pipe and valve calculation. However, this depends on the range of functions.
The problems of non-intelligent piping and instrumentation diagrams
In the past, flow diagrams were not created on a computer but by hand on paper. They were then simple drawings on which more or less limited information could be placed. Although intelligent software solutions are now available, some designers still create flow diagrams by hand or draw them on a computer. Although they use digital help, these flow diagrams are not intelligent and, therefore, cannot be analysed. Only powerful P&ID software, for example, can add additional data and parameters in attributes that can be completely read out and utilised for other purposes. If you wanted to include all this information in one drawing, the diagram would be overloaded and far too complicated. However, if this information is omitted, it must be manually inserted into lists and reference documentation. This procedure is highly time-consuming and error-prone. In addition, when updates are made, all lists must be updated manually, which can lead to delays, errors and misunderstandings.
When is a flow diagram intelligent?
Not all software solutions support the creation of intelligent flow diagrams. In principle, this can already be done with simple graphics programs or even within a word processor or spreadsheet. However, there are usually no options for automatically importing the standardised symbols from corresponding libraries. Furthermore, the operation is complicated, and consistent error-checking by the program is also not possible. Errors are therefore not recognised or only recognised with a long delay. Calculating systems and individual components such as pipework and instruments is only possible with additional, external software or is carried out completely manually.

Create intelligent piping and instrumentation diagrams and use them sensibly
Ideally, companies should choose a proven P&ID solution such as M4 P&ID FX, which enables the creation of both simple block flow diagrams and complex P&ID flow diagrams. Various templates and easy-to-use symbol libraries make the entire design process much faster. Many small and medium-sized companies are reluctant to invest in good P&ID software. Still, experience shows that the time saved and errors avoided justify the investment from the very first projects.
Background information is extremely valuable when it comes to design
It is always a good thing when questions and problems do not require long communication channels. Intelligent P&ID flow diagrams are created using specially designed software containing pure drawings and incorporating so-called attributes into the files. This means that anyone involved in the design can call up the additional information stored in the attributes at any time. This background information includes, for example, specifications, special features, material properties and anything else relevant to the project’s design and execution process of the project. Outside of the design phase, this information also enables flow diagrams to be analysed and evaluated during ongoing plant operation and parts lists to be generated without a great deal of additional effort.
Better utilisation of existing resources
The time saved by using intelligent piping and instrumentation diagram tools can save valuable personnel resources. These can either be reallocated to other tasks or used to speed up the entire process. This is almost always associated with considerable cost savings. The elimination of redundant structures (as occurs, for example, with parallel work in different departments) is another major advantage of networking P&ID design. Overall, the error rate when creating diagrams in design can be reduced by using CAD tools for intelligent piping and instrumentation diagrams in almost every company. It is, therefore, also worthwhile for companies that have previously shied away from the expense of a professional design tool.
Here, you can find out more about holistic P&ID software and try out the benefits for yourself.
Prepared for the future
The design process does not end once the initial design is complete; it’s just the beginning. Changes and adjustments are almost inevitable during operation, particularly in complex process engineering. Even if the design is completely correct and efficient, the requirements change over time. Experience gained during operation or changes in production also impacts design requirements. Those who rely on intelligent piping and instrumentation diagrams can easily incorporate these future requirements and expansions at a later date and adapt the diagram accordingly.
Examples of functions and features of intelligent piping and instrumentation diagram software tools:
- Intuitive operability
- Integrated library with templates and symbols
- Integrated consistency check
- Use of attributes to summarise information
- Integrated creation of parts lists
- Integrated quality check for error correction
- Versatile export options in various file formats
Advantages of intelligent piping and instrumentation diagrams in process optimisation:
- Improved efficiency through time savings and avoidance of redundancies
- Better error prevention, error detection and, if necessary, error correction
- Cost reduction through more efficient processes and resource savings
- Better coordination between the individual departments
- Future-proof for later adjustments
Future outlook for handling P&ID flow diagrams
The introduction of modern technology for the creation of P&ID flow diagrams is far from complete. The introduction of P&ID software was just the beginning. Intelligent software tools now offer a range of useful functions that make designing easier, faster and more reliable. In addition to an adequate reduction in costs, this is, above all, associated with greater efficiency. Things that could not previously be visualised with P&ID flow diagrams are now taken for granted. Designs from flow diagrams can already be transferred to 3D environments and can therefore be viewed from all perspectives on site in the future factory, for example, before even the first order for materials is placed. The details for material orders can also be controlled precisely from a flow diagram and read out using the automatically generated parts list.
New sectors open up
Many industries need diagrams for process design and optimisation, and the path is now also open to small and medium-sized companies, as the market offers easy-to-use yet professional P&ID software. Smaller companies also benefit from the advantages of using P&ID flowcharts.
Summary and conclusion
Although flow diagrams were invented well over 100 years ago, their importance continues to grow. More than ever, efficiency in the design of process plants is a priority because time is money, and those who can save time win many a tender. In large-scale projects, delays are often caused by errors and problems in the design phase. However, they also have a negative impact on a small scale. Today, no ambitious project can be realised without a carefully developed concept and graphic representation in a standard-compliant piping and instrumentation diagram.
- P&ID flow diagrams are indispensable for the design of process plants
- P&ID design with standardised symbols makes design and execution much easier
- Use of powerful P&ID software improves efficiency and drastically reduces error rates
- intelligent piping and instrumentation diagrams offer an unprecedented density and depth of information that is not only relevant in the design phase
In future, intelligent flow diagrams will no longer be the exception but the rule. Collaborations with partners, customers and other specialists can be considerably simplified and made more attractive for everyone involved.
FAQ on piping and instrumentation diagrams
A piping and instrumentation diagram (P&ID) is a detailed diagram used in process engineering. The flow diagram schematically illustrates the arrangement and function of system components, pipework and instruments. It is a crucial tool in the design phase to arrange all process components efficiently and logically. It also supports the analysis and monitoring of ongoing processes.
Piping and instrumentation diagrams are of fundamental importance in almost all industries in which process engineering processes must be mapped. These include the chemical and petrochemical industry, the food industry, the pharmaceutical industry, the metal industry, power generation, environmental technology and utilities. Flow diagrams help to clearly visualise the complex arrangement of individual components, pipelines and the associated instruments.
A piping and instrumentation diagram provides a detailed view of various system components and includes information on machines, apparatus, pipework, fittings and valves. It also contains information on material flows, energy sources, nominal sizes, pressure levels and pipework materials.
Various technical standards are used when creating piping and instrumentation diagrams, including DIN EN ISO 10628 for the chemical and petrochemical industry. These standards ensure that the flow diagrams are clear, understandable and standardised.
Intelligent piping and instrumentation diagrams created with specialised P&ID software such as M4 P&ID enable better fault detection and elimination, cost reduction through more efficient processes and better coordination between the various departments. The piping and instrumentation diagrams created here contain all relevant information that can be analysed during the project.